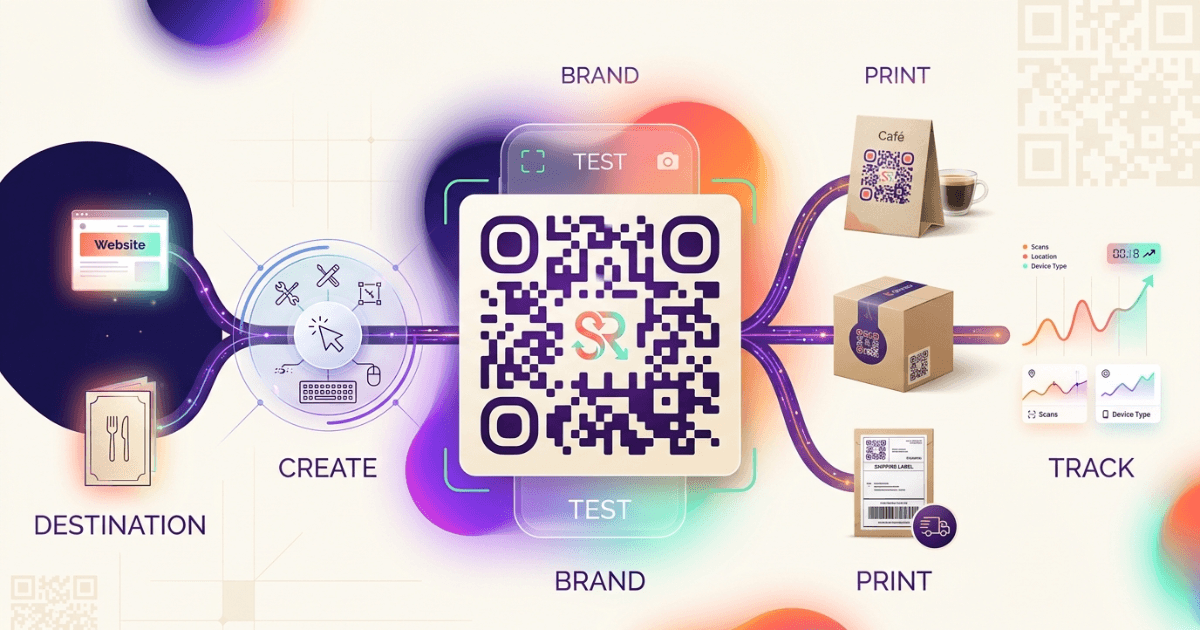
QR code tracking and analytics turn a static scan into measurable data. If you only know that a code works, you still cannot tell which channel, place, or message drove the result.
For software teams and technical decision makers, the goal is simple: connect each scan to an outcome. That means cleaner attribution, better campaign decisions, and fewer guesses about what actually moved users.
Why Track QR Code Performance?
Tracking matters because a QR code is only useful when it produces action. A scan without context tells you almost nothing about intent, location, or conversion quality.
With QR code tracking and analytics, you can compare poster placements, packaging versions, event booths, and print runs. You can also see whether a code is being scanned but not converting, which often points to a weak landing page or a slow mobile flow.
This is where dynamic codes help. Our own guidance on static vs dynamic QR codes explains why dynamic codes are usually the right choice when you need scan data and later edits. If you also want a broader technical primer, the ultimate guide to QR codes is a useful companion.
Tools and Platforms for QR Code Analytics
The best tool depends on how much control you need. Some teams only need basic scan counts. Others need event-level data, UTM support, and CRM tie-in.
- Built-in dashboard tools in QR platforms for scan volume, time, device, and location.
- Analytics suites such as Google Analytics 4 for downstream behavior after the scan.
- Short-link systems like Shrno when you want QR codes and click data in one place.
- Product analytics tools when scans should map to signup, trial, or purchase events.
If your team already uses branded links or short URLs, Shrno can fit well into the workflow. For teams that need a wider campaign view, Commenda is also worth reviewing as part of a broader measurement stack.
For the external side, the official Google Analytics docs are the best reference for campaign measurement, while UTM parameter guidance shows how to label traffic so scan sources stay visible in reporting.
Setting Up Tracking for Your QR Codes
Start with a tracked destination. Do not encode a final campaign URL directly if you need flexibility. Use a dynamic QR code that points to a redirect layer you control.
Then add UTM parameters to the landing URL. Keep the names stable and readable. For example, use source for the medium that printed the code, campaign for the initiative, and content for the specific asset or placement.
- Create one unique QR code per placement, not one per campaign.
- Use a redirect or short-link layer that records the scan event.
- Attach UTM tags to the destination URL.
- Test the full path on iOS and Android before printing.
- Verify that analytics receives the session and the conversion event.
A practical rule: if you cannot trace one code to one placement, your data will blur fast. That is the same problem teams run into with broad link sharing, which is why branded links and URL shorteners are often part of the same measurement plan.
At publish time, print a test code, scan it from different devices, and confirm the final landing page preserves the intended tags. This small check prevents broken attribution later.
Key Metrics to Monitor in QR Code Tracking and Analytics
Good reporting starts with a few core numbers. Do not track everything at once. Track what helps you decide whether to scale, move, or stop a QR placement.
- Total scans: the raw count of code reads over time.
- Unique scanners: an estimate of reach, not repeat activity.
- Scan-to-visit rate: scans that actually become page loads.
- Conversion rate: visits that complete a signup, sale, or other goal.
- Device and OS mix: useful for mobile UX checks.
- Location and time patterns: helpful for placement and timing decisions.
The most useful metric is often not scans alone. It is the ratio between scans and the final outcome. A poster with fewer scans may still win if it drives more qualified users.
This is where QR code tracking and analytics becomes operational, not cosmetic. You are not just counting activity. You are learning which scan source creates value.
Interpreting QR Code Analytics Data
Read the data in layers. First, ask whether people noticed the code. Then ask whether they trusted it enough to scan. Finally, ask whether the landing page kept them moving.
A high scan count with weak conversion usually points to a post-scan problem. Common causes include slow load times, vague copy, the wrong mobile format, or a landing page that does not match the promise on the printed asset.
Low scans with strong conversion can still be a win. That pattern often means the placement is narrow but well targeted. In that case, scale the same message to more high-intent surfaces before changing the offer.
For teams used to click analysis, the logic is similar. A clear breakdown of behavior after the first tap matters more than raw traffic. Our guide to click analytics with Shrno covers that same idea from the link side.
Improving Campaigns Based on Analytics
Use the data to make one change at a time. If you change the code, the placement, and the page together, you will not know what helped.
- Move weak codes to stronger foot traffic areas.
- Swap short copy for a clearer call to action.
- Match the landing page to the printed promise.
- Use different QR codes for different audiences.
- Retire placements that scan often but convert poorly.
Teams that keep a tight feedback loop usually improve faster. A weekly review of scan trends, conversion data, and device mix is often enough to catch bad placements early.
If your stack already includes branded links or short URLs, tie QR performance back to the same reporting model. That keeps campaign reviews consistent across print, web, and social channels.
Frequently Asked Questions